
3:07CDrawing column graphs
Statistics (Data) — Level 3
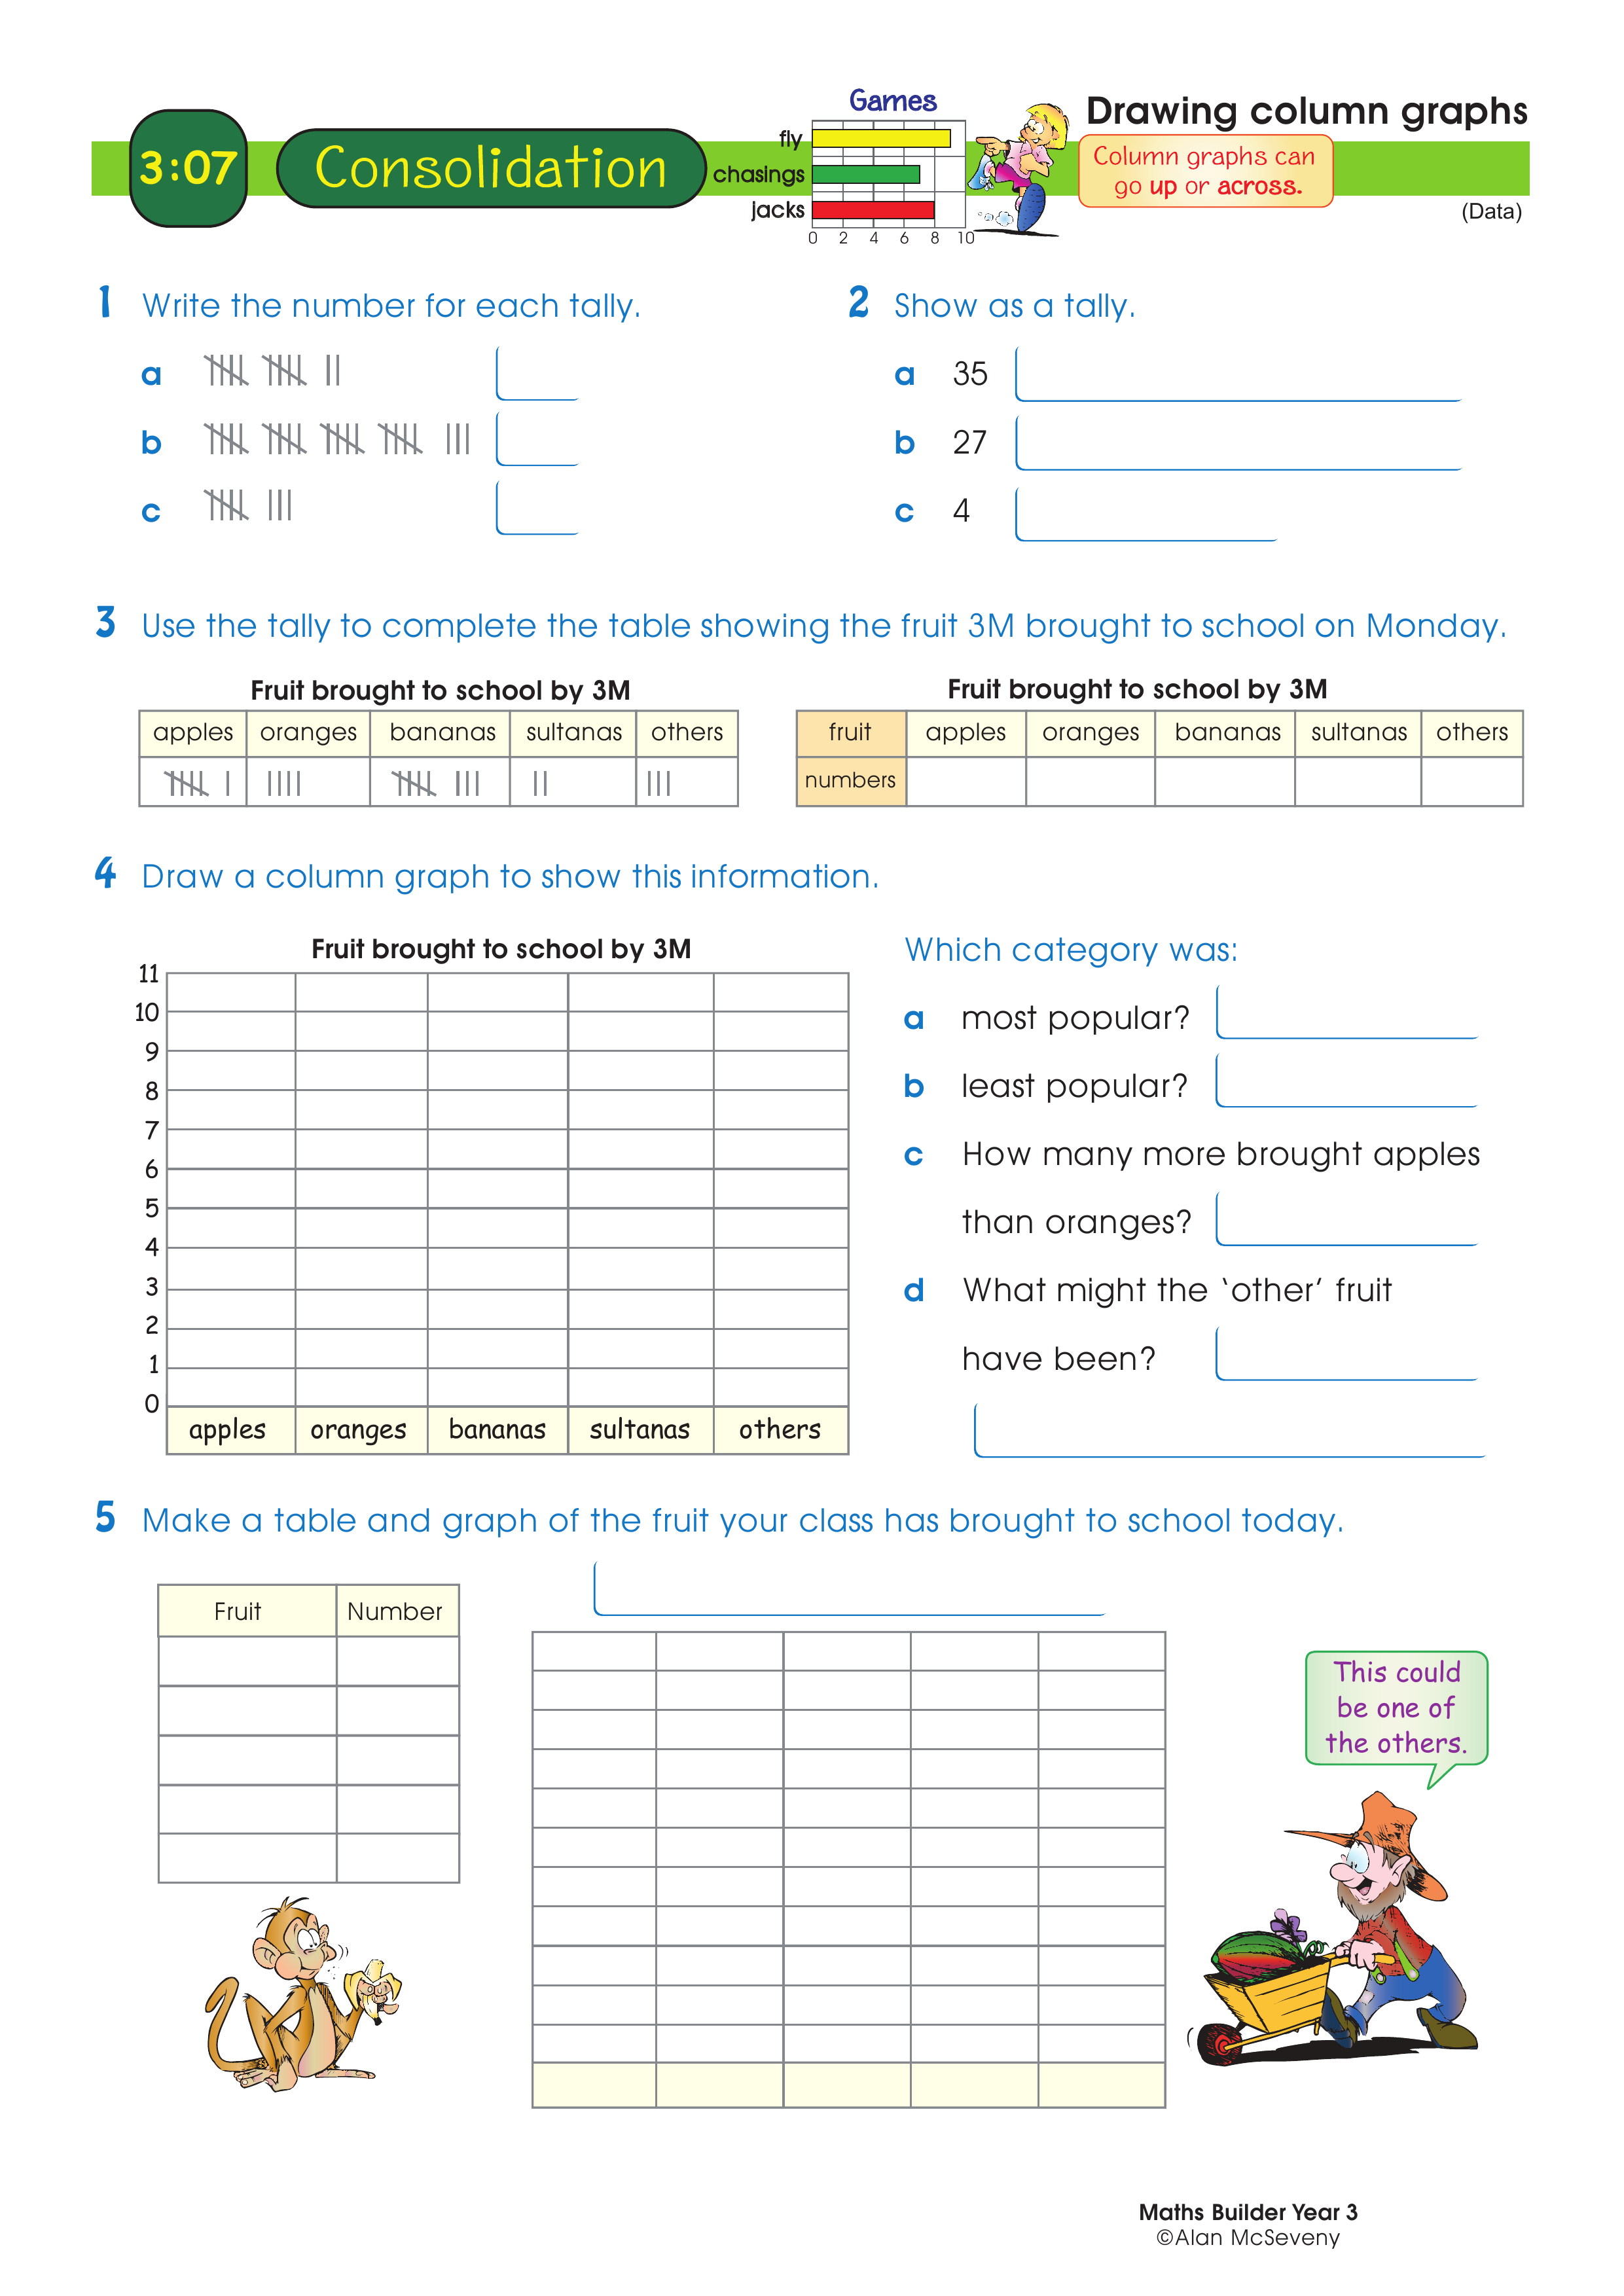
Read and draw tally marks. Use tally to complete the table. Interpret and draw information into a column graph. Collect data to make a table and graph.
Topics covered
- Statistics and Probability › Data representation and interpretation › Creating lists and tables
- Statistics and Probability › Data representation and interpretation › Methods of data collection
- Statistics and Probability › Data representation and interpretation › Identifying categories of data
- Statistics and Probability › Data representation and interpretation › Constructing column graphs
- Statistics and Probability › Data representation and interpretation › Interpreting the data of different displays

