
5:SP01Interpreting picture graphs
Statistics (Data) — Level 5
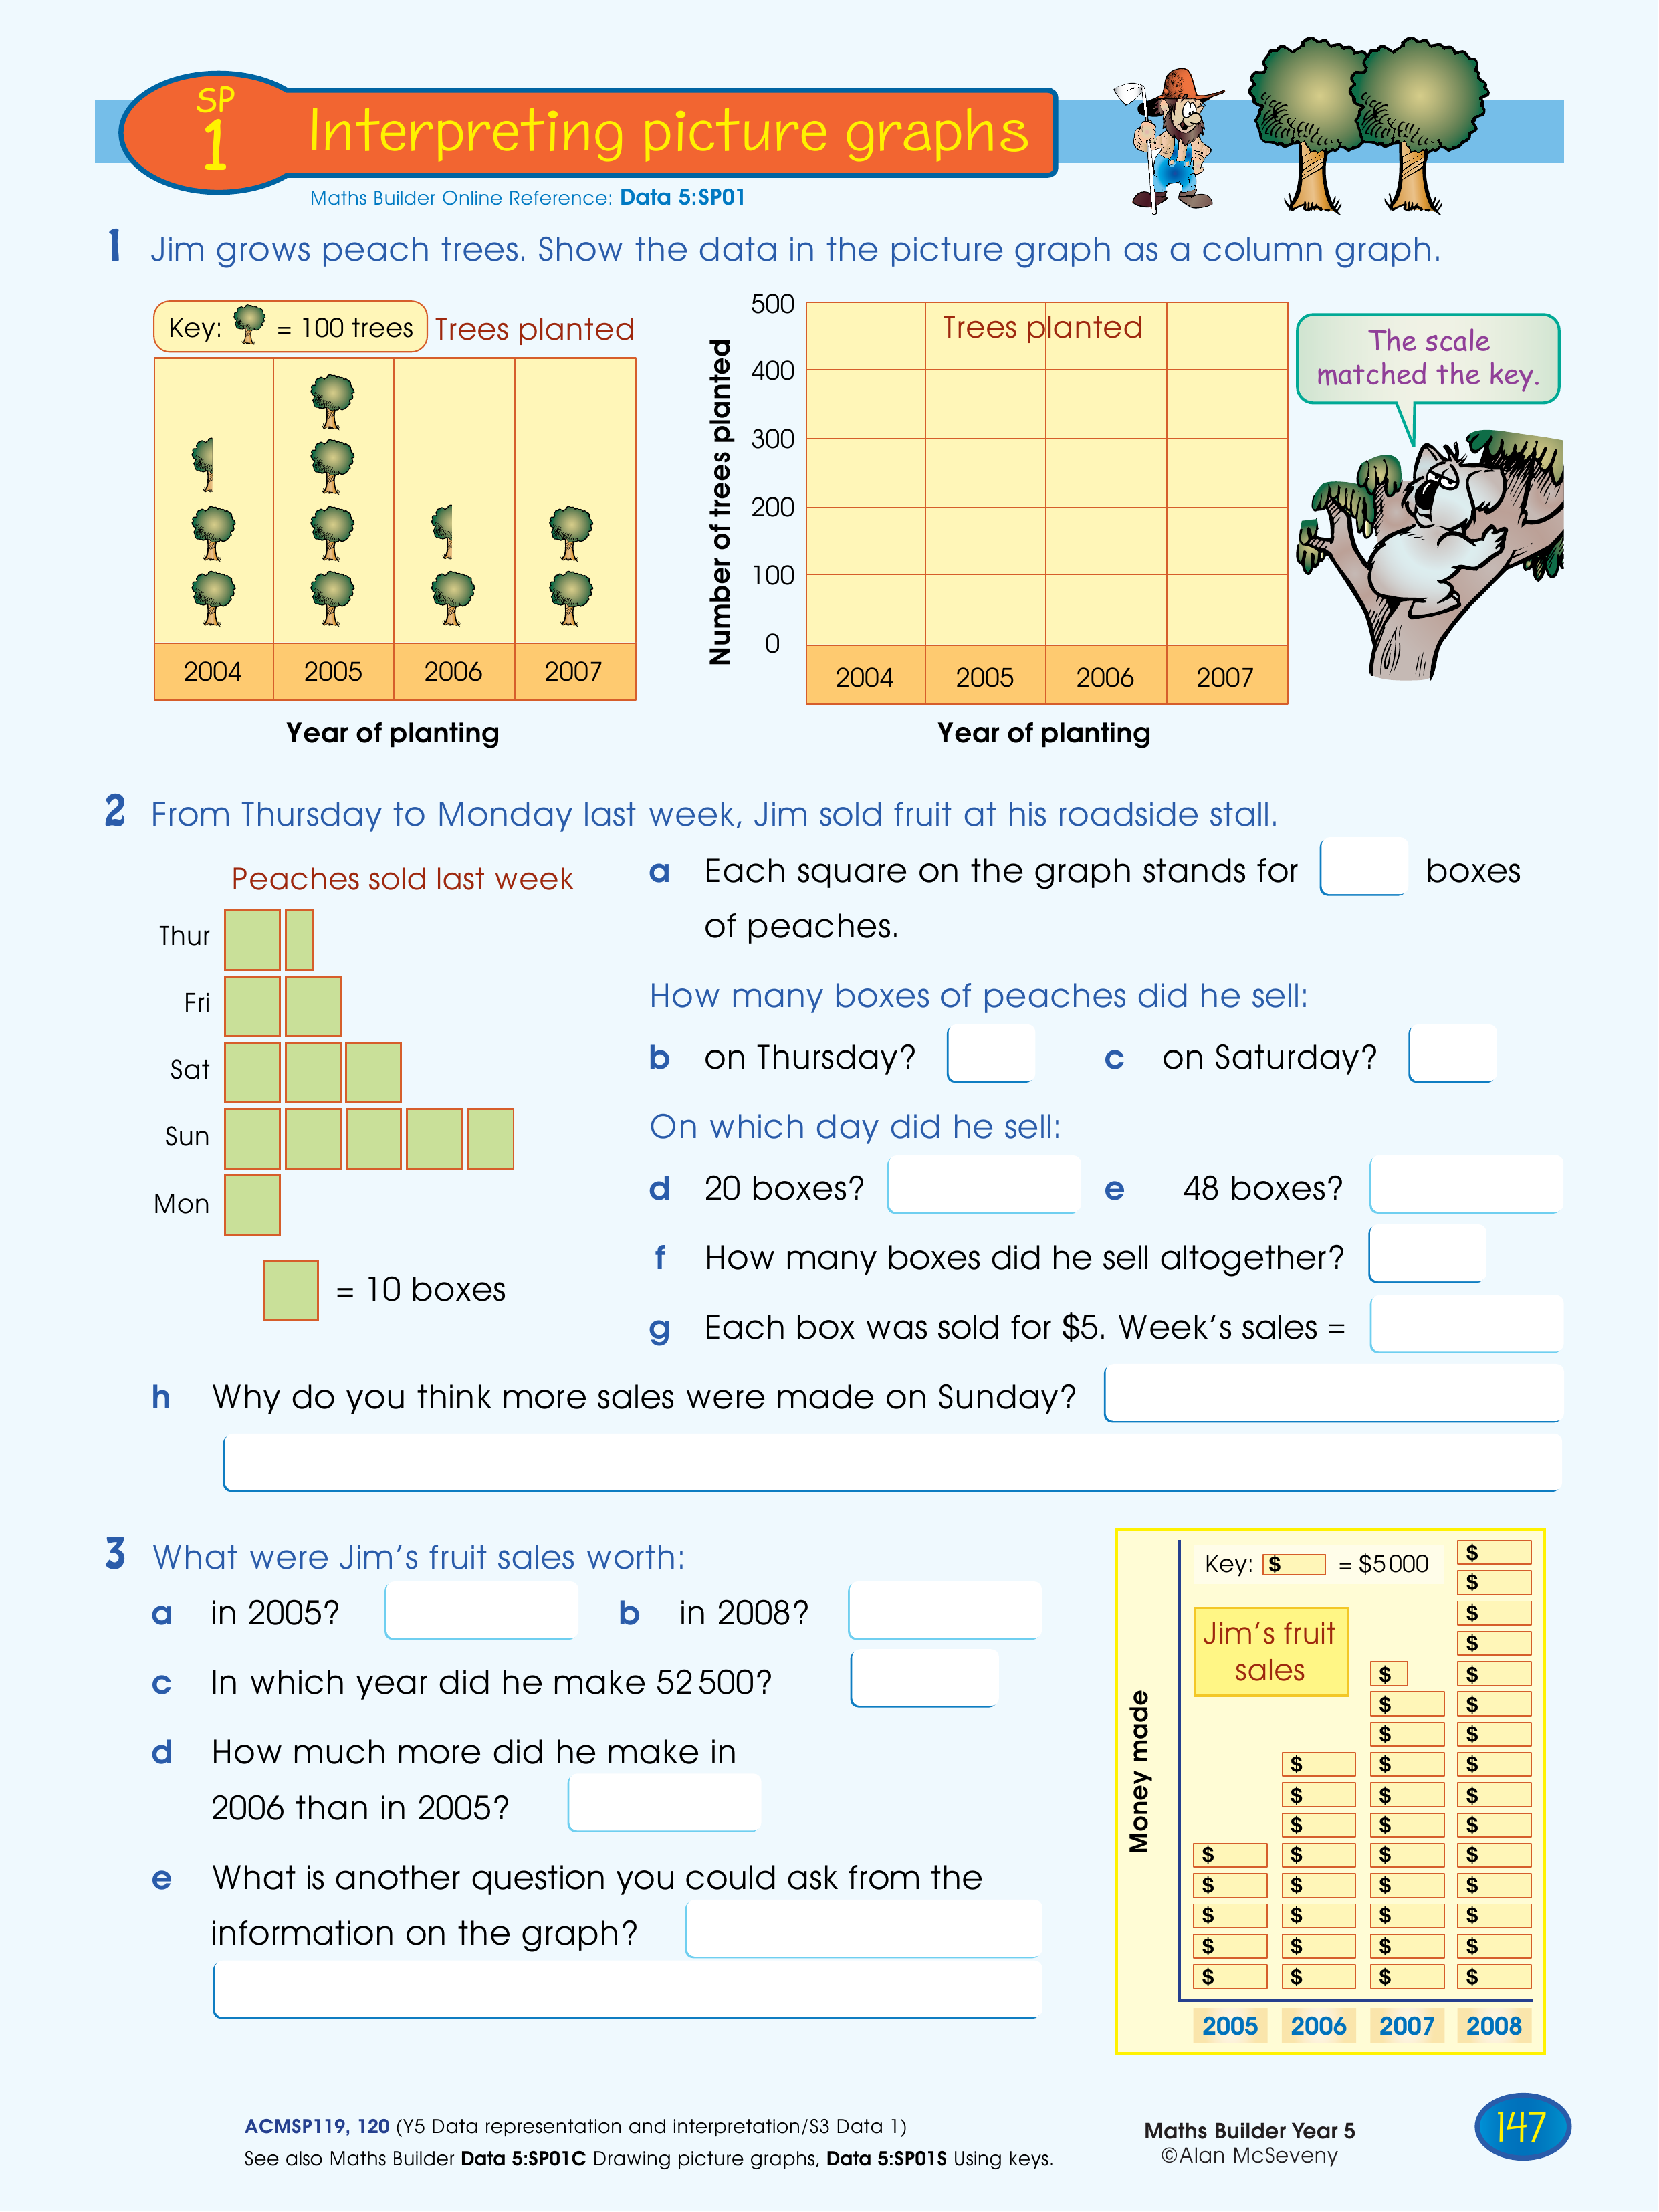
Show the data in the picture graph as a column graph. Discover the scale of the key and answer the questions. Draw conclusion from the data. Make up a question from the graph.
Topics covered
- Statistics and Probability › Data representation and interpretation › Representing data in tables and graphs
