
6:SP10CLine graphs
Statistics (Data) — Level 6
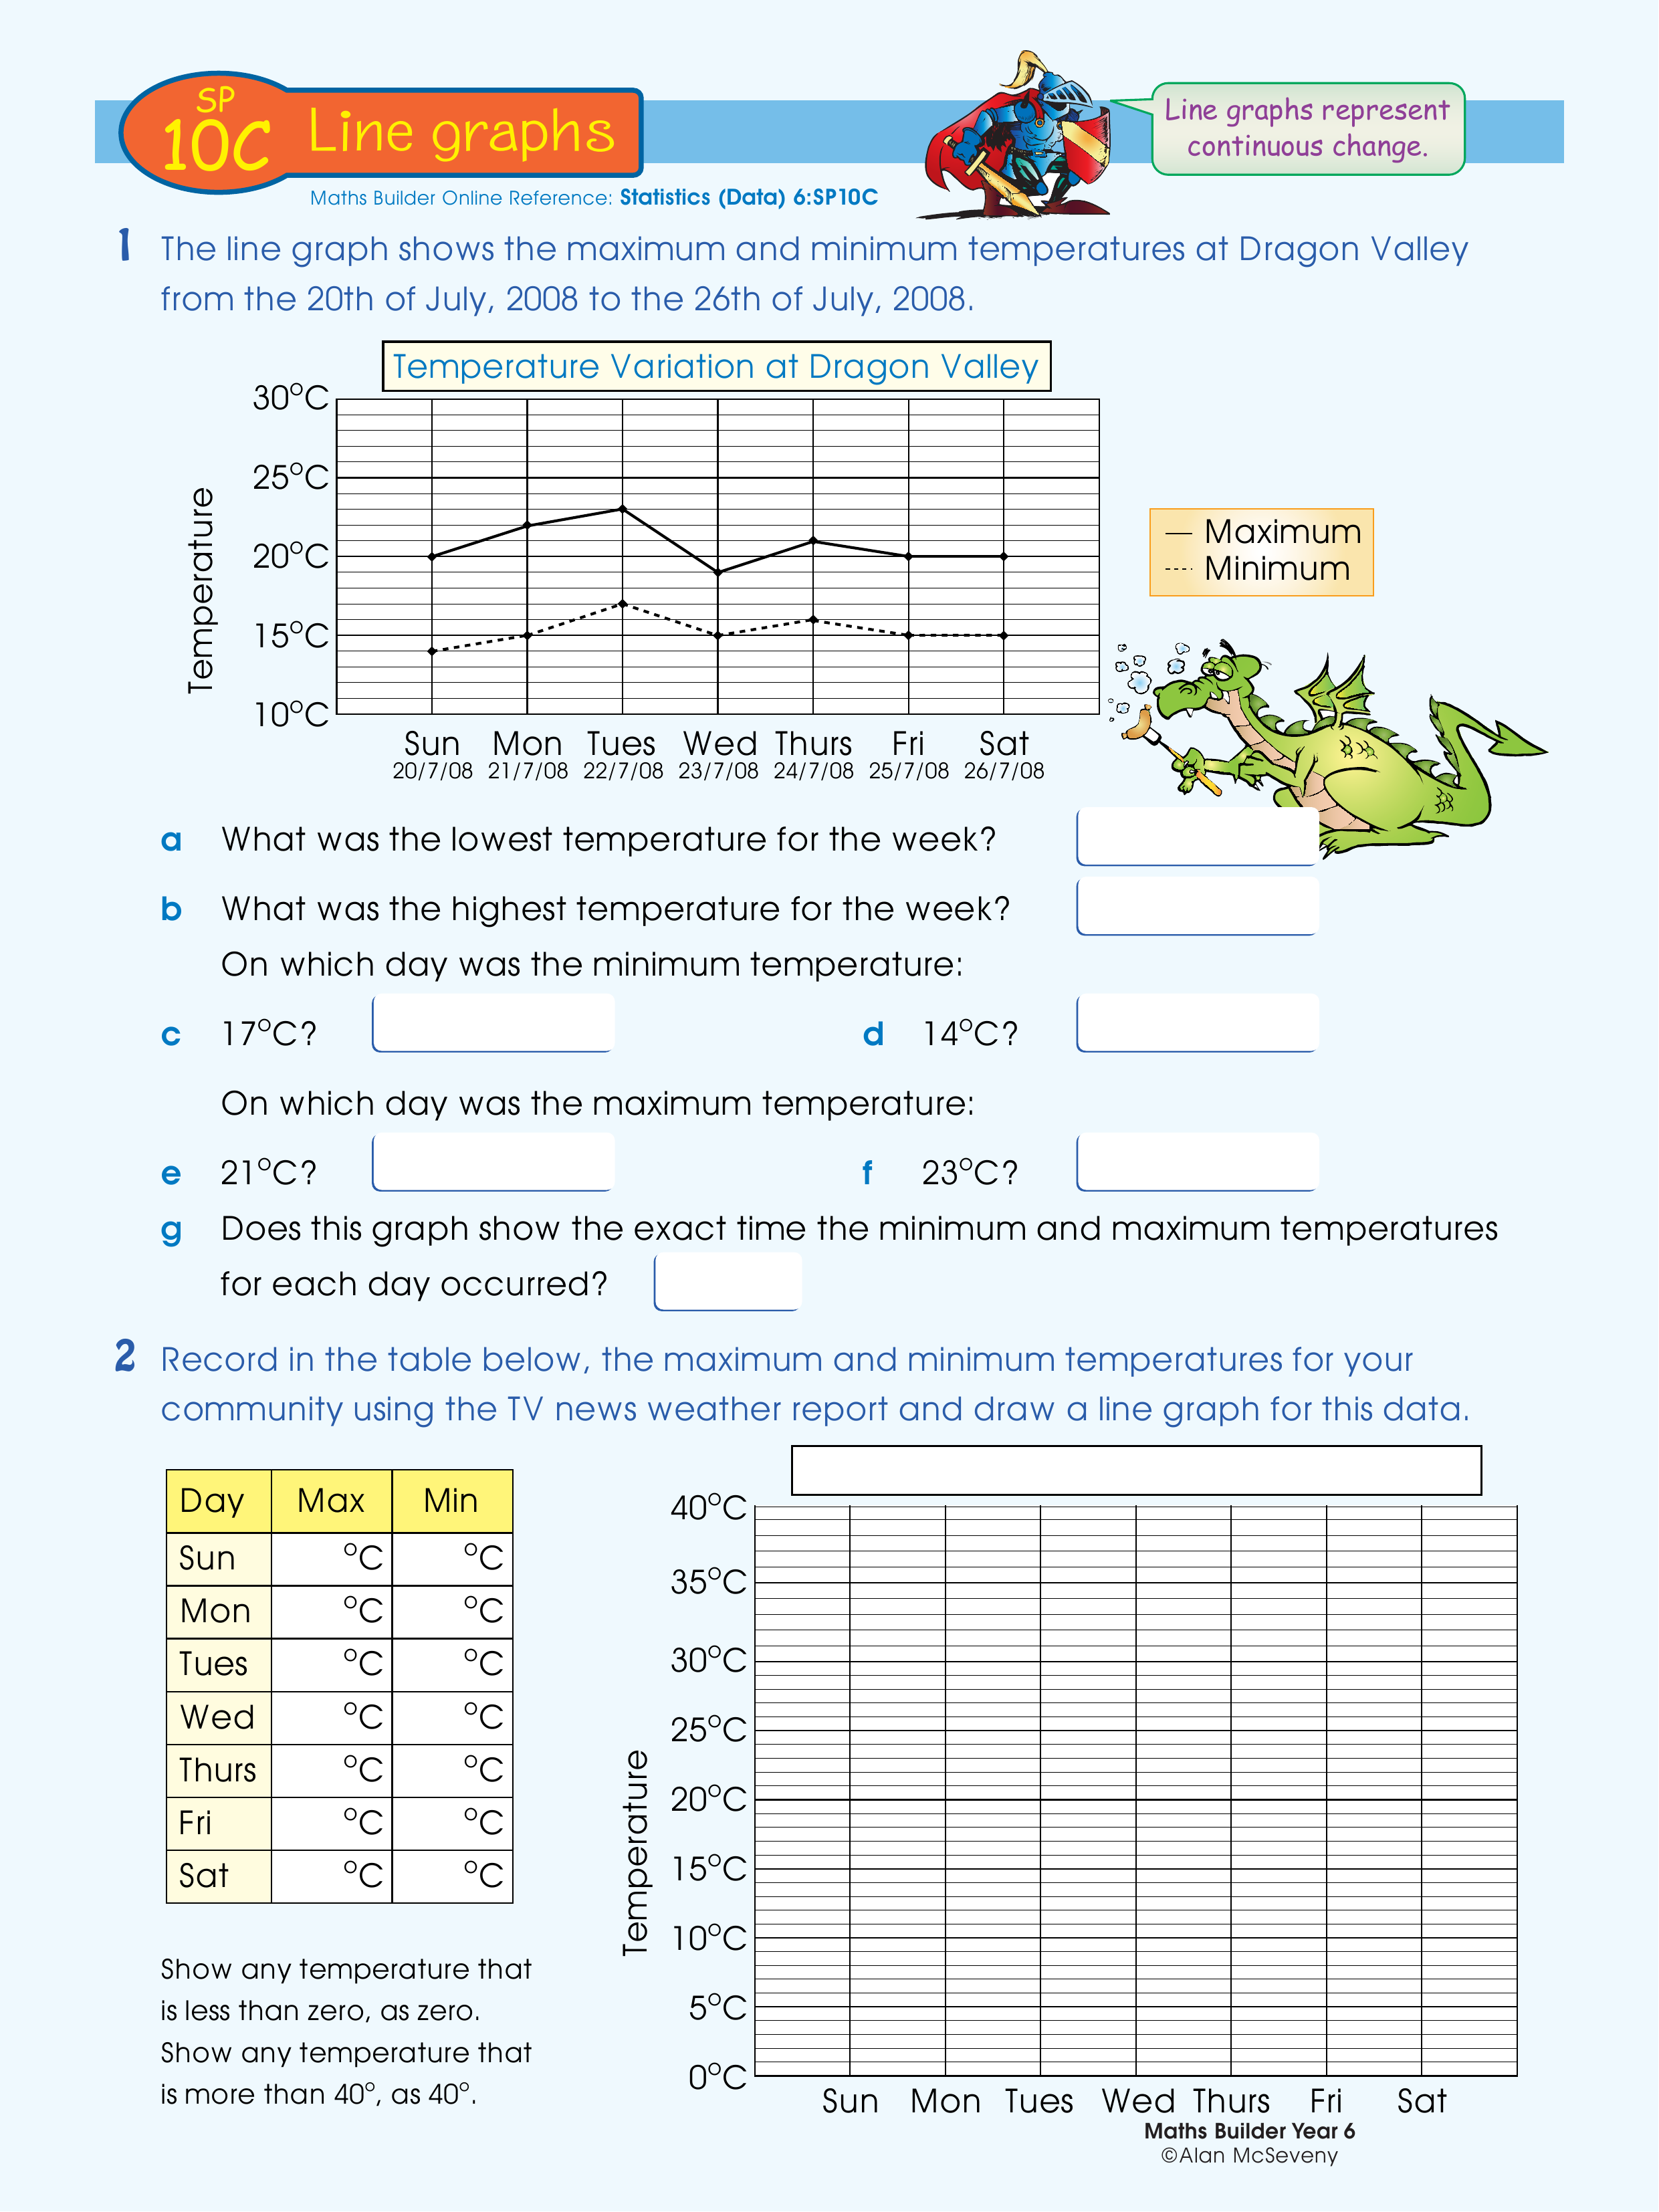
Extension page. Interpret line graph. Record max. and min. temperatures for your area on table and create a line graph.
Topics covered
- Statistics and Probability › Data representation and interpretation › Interpreting secondary data


