
2:SP10Using graphs
Statistics (Data) — Level 2
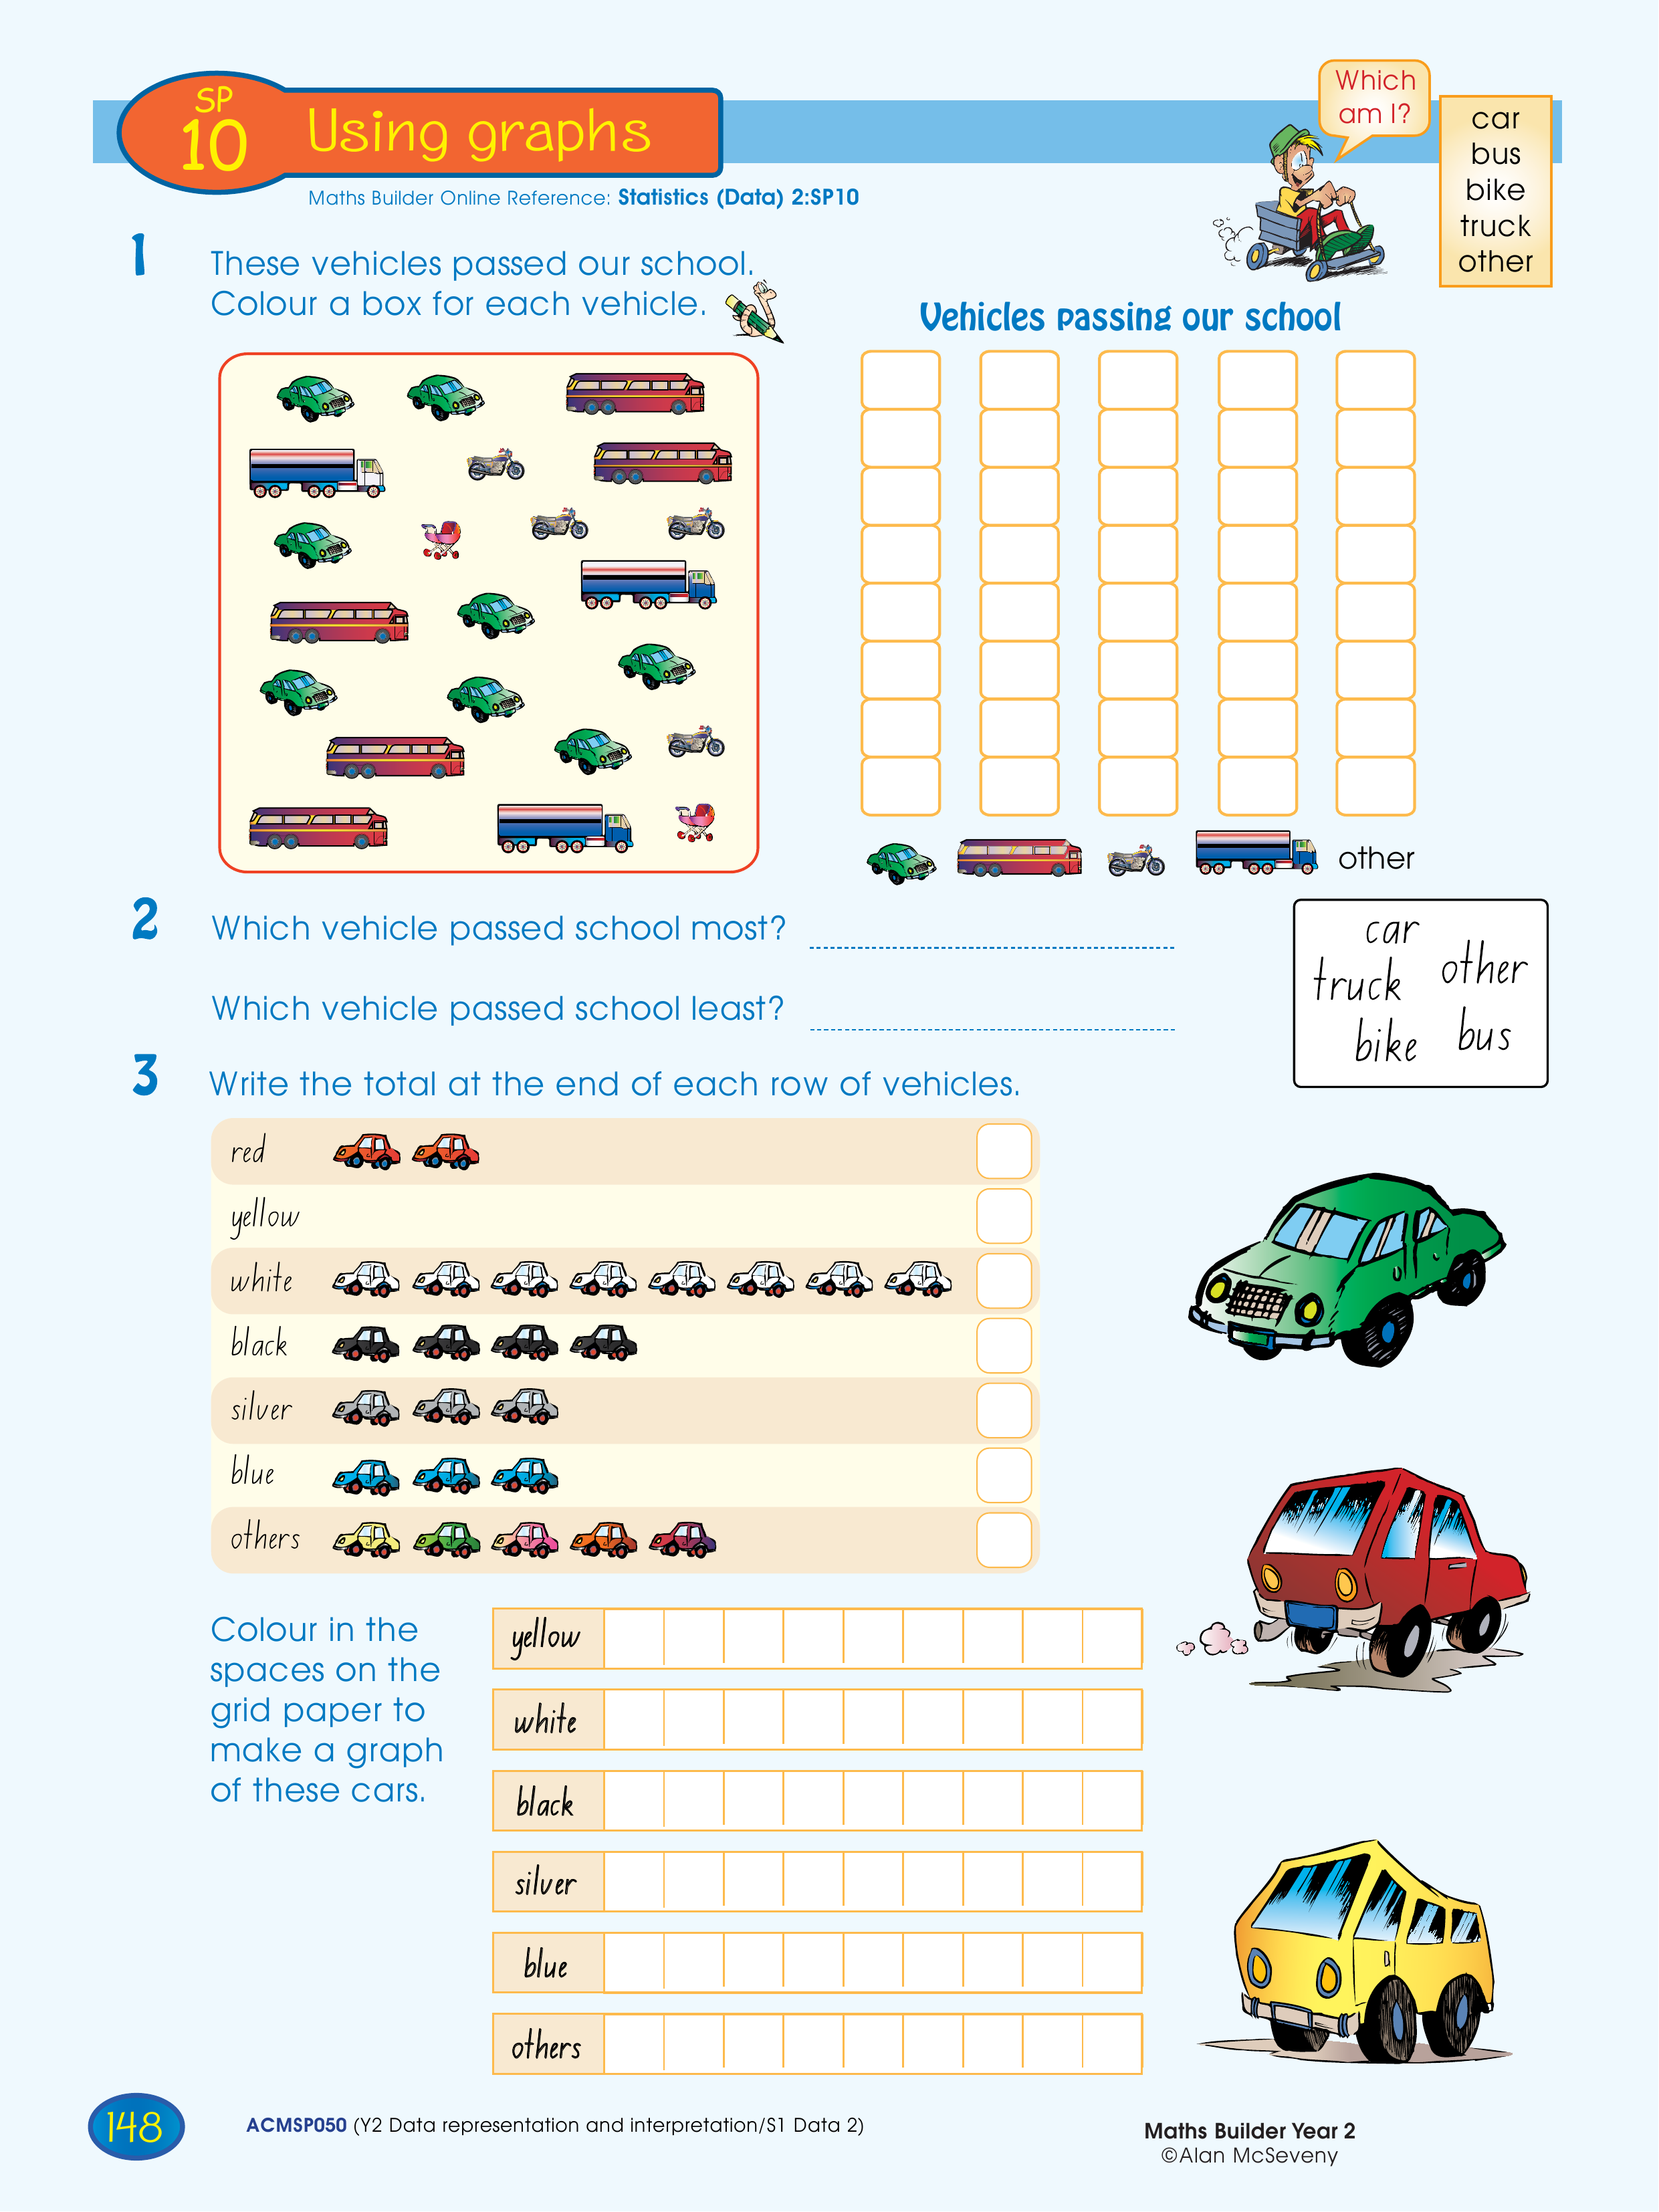
Colour boxes to make a graph showing vehicles that passed. Read most and least. Write the total at the end of each row on horizontal graph. Make a graph by colouring boxes horizontally.
Topics covered
- Statistics and Probability › Data representation and interpretation › Interpreting displays


